Building a Recurring Report (Factsheets)
This tutorial is an end-to-end reference for setting up a recurring, data-driven report - such as a monthly fund factsheet - from scratch in Octigen. Follow it once to build the pipeline, then reproduce the report every period by dropping in fresh data and setting a couple of parameters.
Who this is for
You want a report that looks exactly the same every period and always reflects updated figures, with as little manual work as possible. Classic examples are fund factsheets, monthly performance reports, and regulatory one-pagers.
Assumptions:
- You already have a finished report design as a PowerPoint template (the factsheet layout, charts, tables, and text boxes).
- You already receive your source figures as Excel workbooks (exported from your data warehouse, portfolio system, or spreadsheets).
The situation
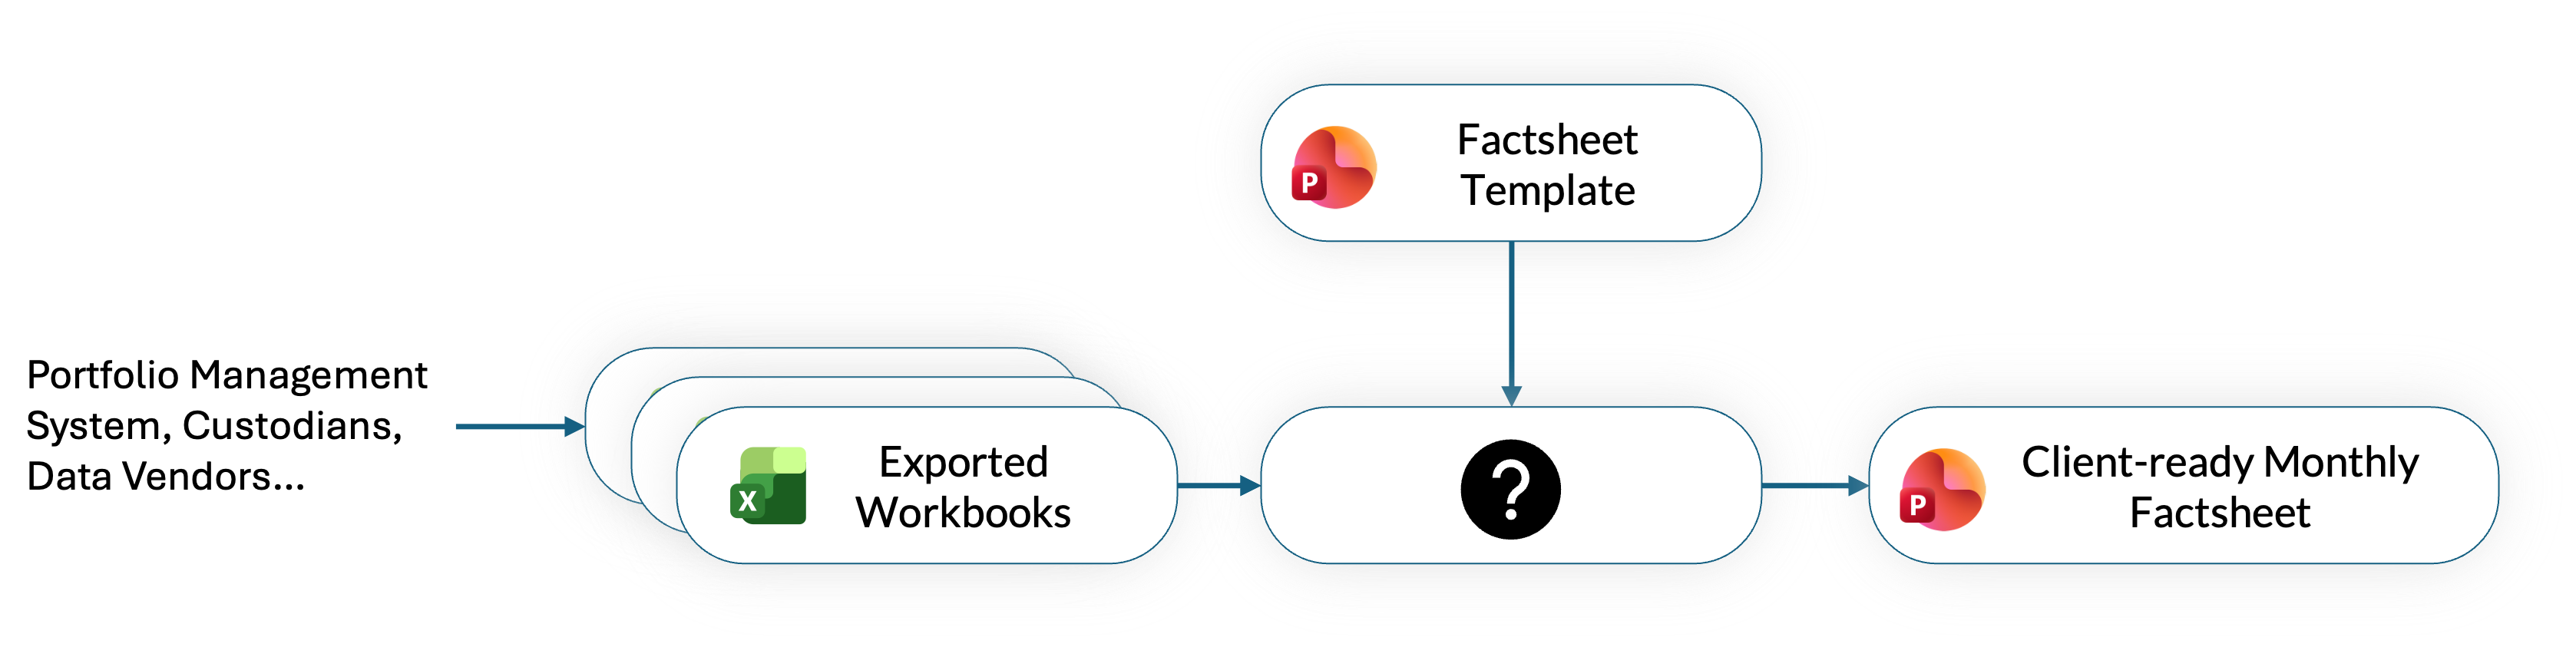
You have workbooks with the numbers and a PowerPoint template for the layout - but no reliable, repeatable way to get from one to the other. Today the "how" in the middle is a manual, error-prone step.
The solution
Octigen replaces that manual middle with a deterministic pipeline: ingest the workbooks into the data warehouse, shape the data to match your template, then connect it to the template through a workflow. The result is a client-ready factsheet produced the same way every period.

Because this report must always represent the same information in exactly the same way, we recommend a mostly deterministic, data-driven setup rather than leaning on AI during production, so nothing is left to chance. You can still opt AI in for specific parts (for example a monthly commentary) - see Step 4.
The setup is four steps:
- Set up the template in Octigen
- Create data collections for your workbooks
- Transform the data to match your template
- Build a workflow and connect the data
Step 1 - Set up the template
Upload your PowerPoint factsheet as an Octigen template and configure it so Octigen knows what each shape is for: which slides are which, and which shapes are charts, tables, and text fields.
- Creating Templates - upload and the basics of a strong template.
- Configuring Templates - categorize slides and name/classify shapes.
While configuring, if you want to use the factsheet in AI-driven production workflows, mark everything that must never change - logos, disclaimers, static footers - as Fixed. Fixed shapes are carried into every generated report untouched. See the Fixed-shape guidance in Creating Templates. This is one of two ways to lock static content down; the other (connecting live data) is covered in Step 4.
After Step 1: automated or manual setup
Once your template is uploaded and configured, you can build the data pipeline in two ways:
Automated - Report Onboarding
Use Report Onboarding (Data → Report Onboarding in the app) when you want Octigen's data assistant to set up the pipeline for you. This is an alpha feature aimed at getting you about 80% of the way; complex cases often need follow-up edits in the warehouse and transformations.
- Select the template to integrate against.
- Upload the source workbooks for one concrete report run.
- Upload a sample report (
.pptx) that contains exactly that data - the ground truth for verification.
The assistant creates collections, transformations, and a data-driven workflow, then runs the report and scores the output against your sample (with up to three improvement rounds). This replaces manual Steps 2–4 below in a single background task — with every ingestion point and transformation left transparent so you can tweak them afterward.
Best when you have representative workbooks and a correct sample report and want a fast, repeatable starting point.
Manual - Steps 2–4
Follow the steps below when you prefer to build and inspect each part yourself, need unusual data layouts, or want full control over every collection, transformation, and connection from the start.
Step 2 - Create data collections
Set up data collections in Octigen's built-in data warehouse to receive the data points from your workbooks. A data collection is a smart container that knows how to identify and retrieve the right file for a given set of parameters.
- Data Collections - create collections and define parameters.
- Data Landing Zone - bulk-drop workbooks each period; Octigen matches each file (and sheet) to the right collection automatically.
Rules of thumb:
- One data collection per data sheet. If a workbook has several sheets feeding different parts of the factsheet, give each sheet its own collection.
- Use consistent parameters across all collections - same names, same meaning. For factsheets it usually makes sense to key everything on a valuation date and a fund identifier. With those two parameters you can always address the right data lines / sheets / files belonging to the report, no matter which collection they live in.
Consistent parameter names are what let a single set of inputs (one date, one fund) resolve every shape on the factsheet in one go. See parameter mapping types for how a parameter is read from a filename, a sheet, or a row value.
Step 3 - Transform the data
Raw sheets rarely match the exact shape a chart or table needs. Use transformations to turn each collection into a table that follows precisely the target format of your template - the right columns, the right order, header removed where needed, one fund/row filtered in, and so on.
- Transformations - chain steps (keep columns, filter, sort, combine, transpose, add calculated fields) on top of a collection.
A transformation inherits its sources' parameters and behaves like a collection, so its output can be connected directly to shapes in Step 4. Aim to get each table into the exact layout the corresponding template shape expects before you connect anything.
Step 4 - Build the workflow and connect the data
Create a workflow under your factsheet template and use it to link each transformed table to the tables, charts, and text boxes in the template.
- Creating Workflows - set up a workflow on the template.
- Data Connections in Workflows - pre-wire each chart, table, and text field to a collection or transformation.
Once connected, producing next period's factsheet is just: provide the parameter values (valuation date, fund identifier) and generate. Everything resolves deterministically. See Using Data in Presentations and Configuring Data for Slides.
Deterministic vs. AI-assisted
You can make the workflow fully data-driven (every shape connected, nothing for AI to decide) or let AI edit specific parts - a monthly commentary being the common case.
If you allow AI anywhere, lock down everything that should not be touched, in one of two ways:
- Connect it to data in the workflow, so its content is determined by the pipeline, or
- Set the shape's usage category to Fixed in the template blueprint (logos, disclaimers, static footers).
How shapes map to data
When you connect a shape, Octigen maps the resolved table onto it as follows:
- Tables (easiest) - connect the transformation whose columns and rows already match the template table. Column names become headers (unless a Remove header step was used); rows become table rows.
- Charts - the first column holds the categories (for factsheets, usually the date); each additional column is a series; the rows are the values. Design the template chart with at least as many series as you expect (Octigen adds more if needed but won't auto-pick colors beyond your defined series).
- Text boxes - each row becomes a paragraph and each column (cell) becomes a text run within that paragraph. This is how data can drive multi-line text like fund names or disclosures.
For the full mapping reference see Using Data in Presentations and, for text runs specifically, Data Overview.
Producing the report each period
Once the pipeline is built, the recurring cycle is short:
- Drop the period's workbooks into the Data Landing Zone - collections ingest automatically.
- Start a report from the workflow and enter the parameters (valuation date, fund identifier).
- Generate. Connected shapes populate deterministically; only the parts you deliberately left to AI (e.g. commentary) are drafted.
- Review and download.
Checklist
- Template uploaded and configured
- Only relevant for AI+data driven flows (e.g. commentaries are AI-generated): static shapes marked Fixed, AI-updated marked Change Required.
- One data collection per source sheet, all sharing the same parameter names (e.g. valuation date, fund identifier).
- Transformations output tables in the exact format each shape needs.
- Workflow connects every data-driven chart, table, and text box.
- A full dry run for one period produces the factsheet correctly end to end.